Data Report
A Decade of Container Growth at Chattogram Port
Chattogram Port’s container throughput increased from 2.26 million TEUs to approximately 3.53 million TEUs over the past decade, representing growth of about 56.4 percent and an estimated compound annual growth rate of 4.6 percent. This BDRS visual research brief examines what that expansion means for the port’s operating system, including the changing distribution of traffic across NCT, GCB, CCT and RSGT Chittagong. It also considers the implications for berths, yards, gates, equipment and future infrastructure investment. The central finding is that sustained throughput growth requires more than additional physical capacity. Infrastructure, equipment and terminal operations must evolve together if Chattogram is to accommodate rising demand efficiently.
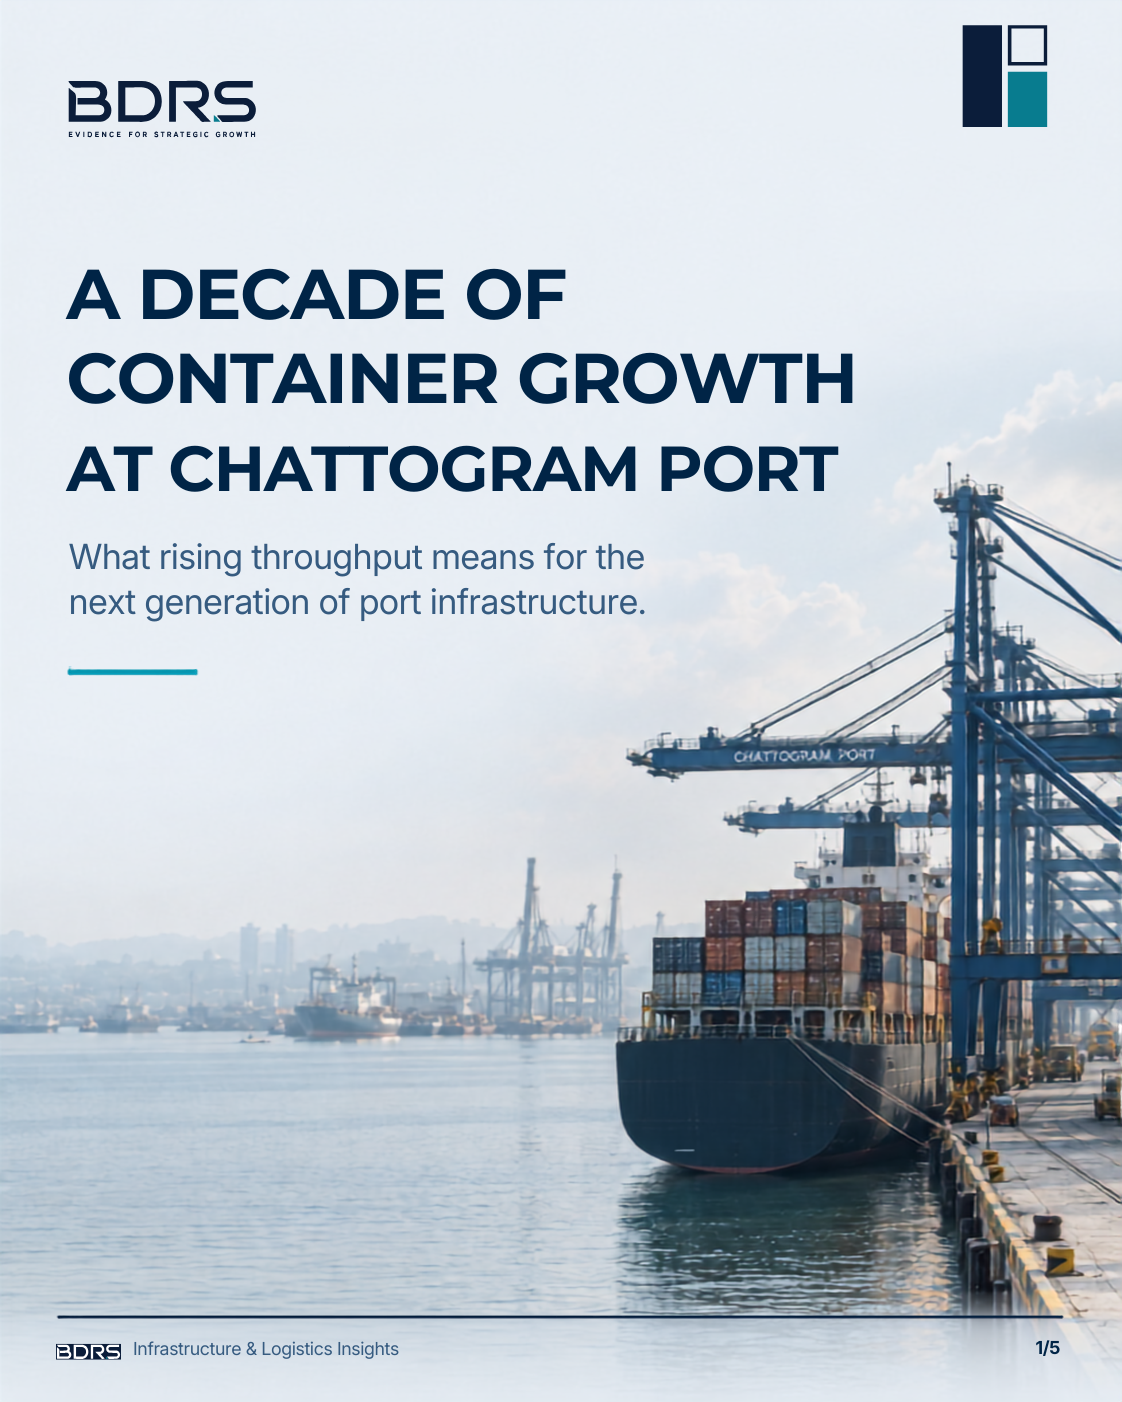
Over the past decade, container throughput at Chattogram Port has increased from 2.26 million TEUs to approximately 3.53 million TEUs. This five-page BDRS visual research brief examines the scale of that growth, the changing distribution of container activity across NCT, GCB, CCT and RSGT Chittagong, and the resulting implications for terminal capacity.
The analysis looks beyond headline throughput to the wider operating system. Rising container volumes place simultaneous pressure on berths, yards, gates and handling equipment. The report therefore frames Chattogram’s next infrastructure challenge as one of coordinated capacity development, in which physical infrastructure, equipment and operations need to evolve together.